
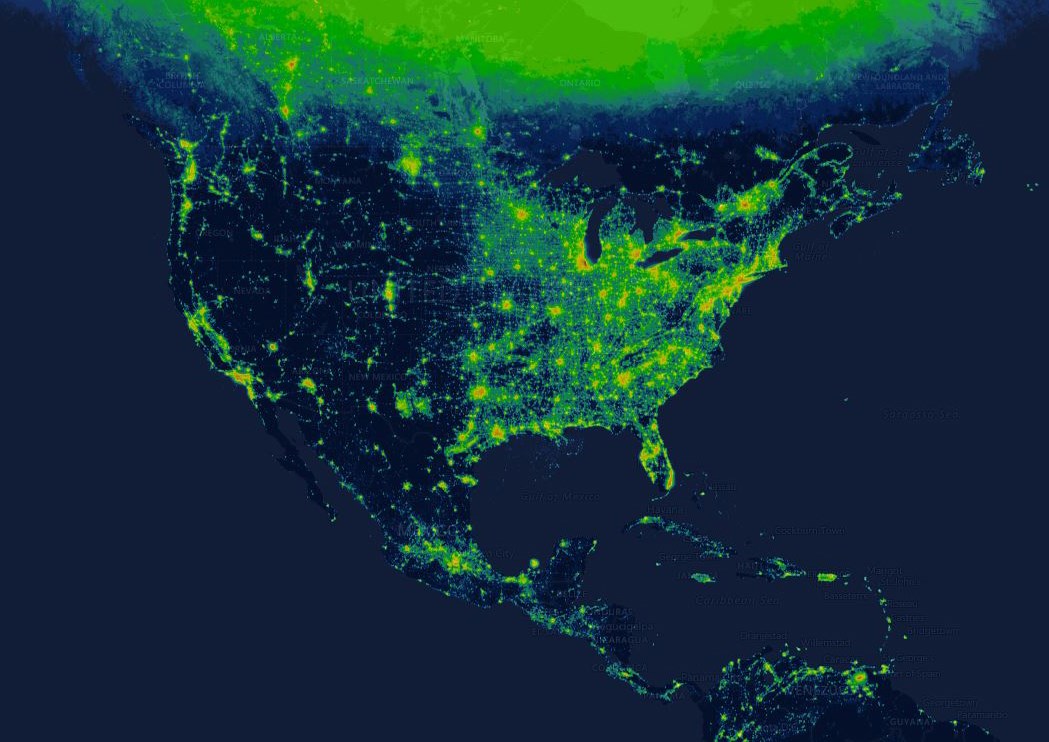
The Radiance Light Trends website, which went live last week, presents a world map that shows where night skies are still relatively dark and where there are hot spots — areas where the blues and black indicating darkness are replaced by greens, yellows and reds indicating the glow of artificial light at night.
“The map shows light emissions on Earth, specifically on clear nights, because that’s when satellites can look down and see all the way to the ground,” said Christopher Kyba, a physicist at the German Research Centre for Geosciences in Potsdam who coordinated the effort to build the website.
Artificial light disrupts the behavior of plants and animals, which evolved in a world without light from buildings, streetlights and other sources. In addition, light pollution has been linked to health problems in humans, including sleep disorders and obesity.
Artificial light also makes life hard for skywatchers and astronomers, who need dark skies in order to make detailed observations of the heavens.
The website, created as part of a European Union-funded project known as GEOEssential, allows users to zoom in on specific regions and go back in time to see how light emissions in a particular area have changed in recent decades. The map features roads, cities and other landmarks that make it easy to find specific locations.
Kyba wanted the tool to be useful for both scientists and the general public. “A lot of satellite data is released for free online to everybody, but just because it’s free doesn’t mean it’s accessible,” he said. “The idea is to give this tool to everyone, so that everyone in the world has access to this data.”
The map incorporates data from now-decommissioned spy satellites that operated from 1992 to 2013. The Suomi National Polar-orbiting Partnership satellite, jointly operated by NASA and the National Oceanic and Atmospheric Administration, is the source of data from 2012 to the present day. The map updates automatically each time new satellite imagery is obtained.
Kyba uses the website as part of an effort to understand how artificial light and “skyglow” produced by cities is changing. He’s planning to make the website’s code available free of charge so similar tools can be made using different data sets from satellites.
“You could do something with sea ice or atmospheric temperatures, or the data about when trees get their leaves,” Kyba said. “For any satellite dataset you can imagine, you could produce a similar system to look at trends over time, so I hope that other people will adapt this for their own uses.”