

The price of gold is moving higher today, helped by the lower USD.
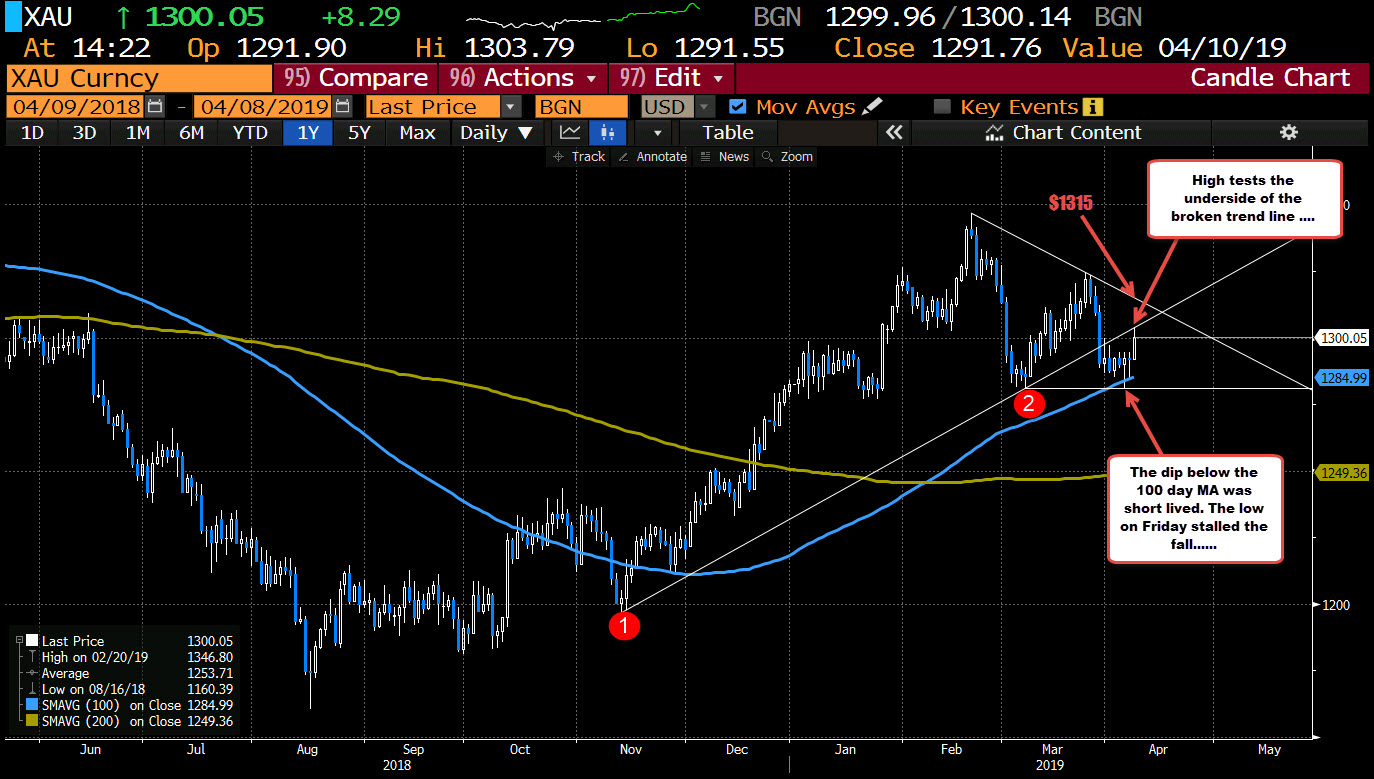
Looking at the daily chart, technically, the price on Thursday last week, the price did fall below the 100 day MA (blue line) but stalled the fall at the lows from March. On Friday, the low found buyers against the 100 day MA. The rise reached the underside of the broken trend line at $1303.70 (high today reached $1303.79 and backed off). There are some sellers against the area.
Drilling to the hourly chart below, earlier in the day, the price moved above the 200 hour MA for the first time since March 28th (green line) That gave the buyers a technical reason to buy. The price – staying above that MA – was more bullish. Eventually the price moved higher. The rise took the price to and above the 50% at $1302.79 (see chart below), but it too found sellers on the failed break.
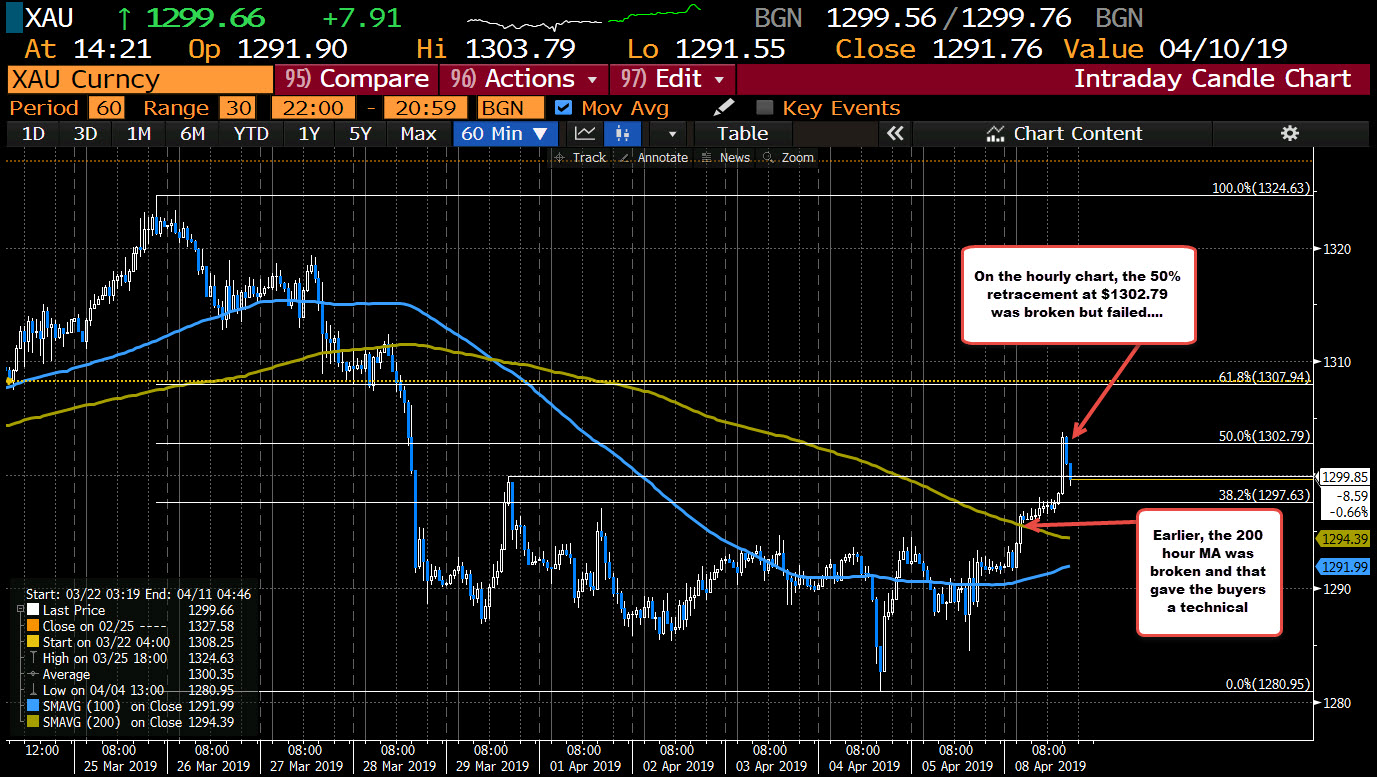
There is some cause for pause at the underside of the trend line and the 50% which has seen some profit taking. Sellers could continue to lean with stops above. It will take a move back above each to solicit more buying now.
Longs, who pushed the price away from the 200 hour MA and looking for more upside, would not like a move back below that 200 hour MA. That would negate the bullish move from today’s price action.